 MEIKAI
From AI visibility to sales: connecting GEO and GEA to ROI
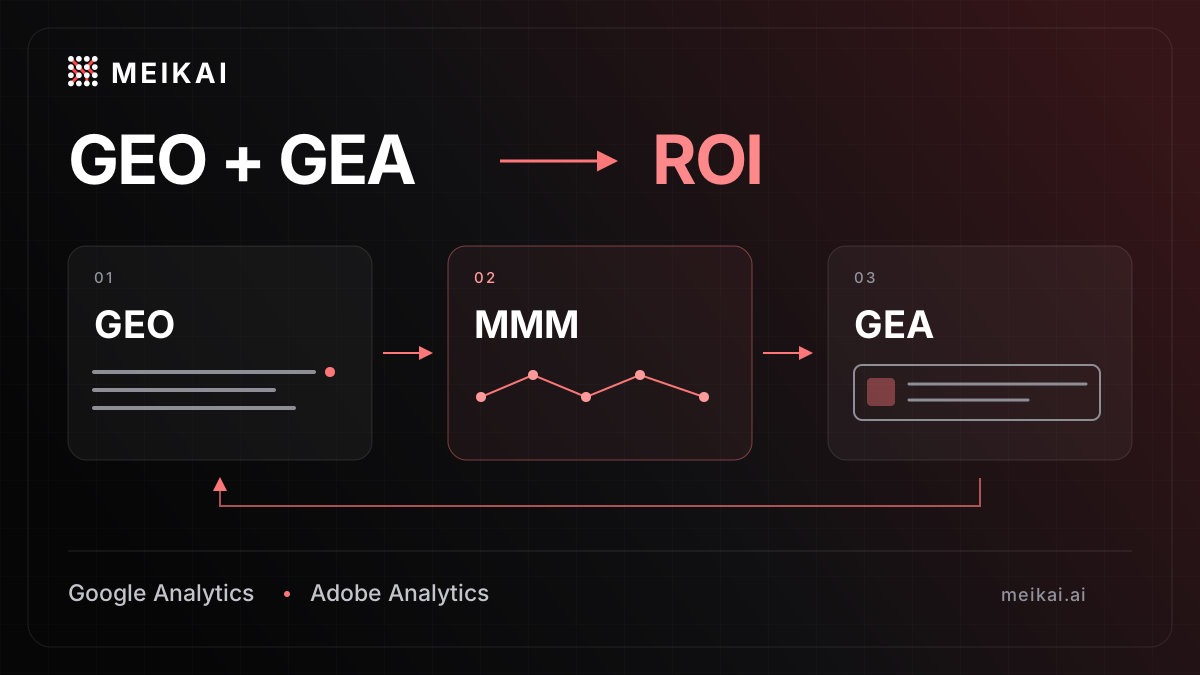
GEO earns its place in the marketing budget when it can be connected to business outcomes: incremental sales, qualified pipeline and profitable customer acquisition. Visibility in AI answers is an important signal. The commercial question is what changes when that visibility improves, and whether the value created justifies the investment.
Generative engine optimisation (GEO) and generative engine advertising (GEA), the paid advertising side of AI discovery, belong in the same return on investment platform as search, social, retail media and other marketing activity. Marketing mix modelling (MMM) helps connect these investments to sales across channels. Google Analytics and Adobe Analytics measure the observable customer journey. Incrementality experiments establish whether an intervention caused additional business.
Used together, these methods create a practical feedback loop: prioritise commercially relevant prompts, measure the lift from GEO, then use the evidence to improve organic investment and GEA efficiency.
Start with the outcome the business needs
For a retailer, the primary outcome might be net sales or contribution margin after returns. For a B2B company, it might be qualified opportunities and eventual closed revenue. Agree the outcome, reporting window and source of truth with finance before choosing a visibility target.
A buyer may discover a product in an AI answer, return through branded search and purchase later. Another may click an AI citation and leave. Referral conversions capture part of that journey; brand mentions capture a different part. Neither alone measures the additional sales created by GEO.
| Measurement layer | What it tells you | Decision it supports |
|---|---|---|
| AI visibility | Mentions, citations and recommendation presence across a defined prompt set | Which buyer questions and content gaps to investigate |
| Web analytics | Identifiable AI referrals, campaign visits, purchases and qualified actions | Which journeys and landing pages to improve |
| Incrementality tests | Additional outcomes relative to a credible comparison without the intervention | Whether to expand a particular GEO or GEA action |
| MMM | Estimated contribution across the marketing mix, with uncertainty | How to allocate investment across channels and markets |
Use MMM to guide which prompt themes deserve investment
Prompt prioritisation should begin with customer needs and commercial value. Group questions by product category, market, purchase stage and buyer problem. “Which running shoes suit my first marathon?” and “Where can I buy this model in my size?” represent different opportunities, even when both mention the same brand. Our guide to prompt modelling explains why that structure matters.
For each cluster, assess evidence of demand, relevance to products you can actually sell, margin or lead value, current visibility gaps and the effort required to improve the answer. Use customer research, site search, sales conversations and available demand data. The number of prompts in a monitoring panel is a sampling choice, not a measure of market demand.
MMM contributes the wider commercial context. It can help identify categories or markets where marketing investment has generated additional sales, where returns appear to be flattening, and where another test would be valuable. Combine that evidence with prompt research to choose the next GEO intervention. A conventional MMM does not tell you the revenue value of an individual prompt; its useful level of detail depends on the data and variation available.
Prepare a consistent history of outcomes, paid media, GEO interventions and relevant business conditions, aligned by period and market. Record content releases, product information improvements and earned-media activity. Treat monitored visibility as a diagnostic indicator: a sampled citation rate is not a count of customer exposures and should not be inserted into a model as if it were impressions.
Google’s Meridian documentation describes how MMM can represent organic media and non-media interventions alongside paid media. Applying that framework to GEO requires choosing defensible inputs and a causal model. Organic contribution estimates also need a separate cost record before they can become an ROI calculation.
Ask the modelling team to account for seasonality, pricing, promotions, availability and other demand drivers. Distinguish those factors from effects that GEO may itself create, such as more branded searches: controlling away an intermediate effect can hide part of the impact. If GEO and SEO activity always move together, or the history is too short, report the combined effect or the uncertainty instead of forcing a separate GEO sales figure.
Measure GEO lift with an explicit comparison
A rise in sales after a content update is a useful observation. Establishing lift requires an estimate of what would have happened without that update. A practical protocol has six steps:
- Define the intervention and primary outcome. Specify the pages, product information or publisher activity being changed, the associated prompt clusters, and the sales or pipeline measure. Record other changes that could affect the result.
- Choose units that can actually receive different treatment. Where feasible, randomise comparable product groups or markets into an intervention group and a holdout. Holding out prompts from monitoring does not hold out real customers from an AI answer. Check for shared pages, cross-market retrieval and other spillovers.
- Set the baseline, duration and detectable effect in advance. Use historical outcome variability, the number of independent units, retrieval delays and the sales cycle to design a test with useful power. Avoid a universal test duration or stopping as soon as the result looks positive.
- Track both delivery and outcomes. Verify that the changes were published and became accessible. Monitor a stable prompt panel repeatedly, alongside analytics and sales data, keeping the collection method consistent. Visibility lift and sales lift remain separate results.
- Estimate the incremental difference. With a suitable randomised design, compare treatment and holdout outcomes using the planned analysis. If randomisation is impossible, a matched comparison or difference-in-differences can support a weaker causal claim, provided pre-trends are credible and no concurrent shock explains the difference. Report uncertainty and sensitivity to those assumptions.
- Feed the result back into investment decisions. Scale, revise or stop the intervention, and use suitable experimental evidence to calibrate the MMM. Google documents this process in its guide to calibrating treatment priors.
Content improvements can also affect conventional search and the on-site conversion rate. Unless the design separates these mechanisms, the measured lift belongs to the whole intervention. Naming the project “GEO” does not prove that every additional sale came through an AI engine.
Illustrative example, not a Meikai client result: suppose the comparison estimates that a product group would have generated €120,000 in net sales during the test. Observed sales are €132,000. Estimated incremental revenue is €12,000, or 10% lift against that counterfactual. At a 40% contribution margin before programme costs, that creates €4,800 of incremental contribution. If the intervention cost €3,000, its estimated net return is €1,800 and ROI is 60%. The confidence interval around the lift still matters.
ROI = (incremental contribution before programme costs − programme costs) ÷ programme costs. Include content, agency, engineering, measurement and media costs where applicable, over a consistent period. Revenue divided by ad spend is ROAS; it does not account for product margin or the full cost of a GEO programme.
Connect the journey through Google Analytics and Adobe Analytics
Web analytics provides the operational view of what identifiable visitors do after arriving. It is essential for improving journeys and validating measurement, while experiments and MMM address a different question: how much business the activity added.
In Google Analytics 4, review session source and medium, landing pages, key events and revenue for identifiable AI referrals. Use consistent campaign tagging for GEA links you control and distinguish paid visits from organic referrals. Validate purchase values, currency, transaction IDs and refunds against your commerce system; for lead generation, connect qualified leads to CRM outcomes. Google’s Traffic acquisition documentation explains the session-level reporting, and its campaign and traffic-source guide covers campaign parameters and referrers.
In Adobe Analytics, use the Conversational AI tools referrer type to examine recognised AI referrals. Combine it with referring domains, landing pages and your configured order, revenue or lead events. Use campaign identifiers and Marketing Channels processing rules to distinguish paid GEA from organic AI referrals; a referrer category alone does not make that distinction.
For either platform, document attribution windows, consent coverage, cross-domain tracking and missing referrers. A visit from an AI domain does not normally reveal the buyer’s exact prompt. A recommendation without a click, or a later purchase through another route, may be invisible as an AI touchpoint. AI features within a search engine may also share its referral source. Keep those blind spots visible, and reconcile revenue to the business’s sales records.
Use GEO evidence to improve GEA efficiency
GEO research reveals the needs buyers express, the competitors they compare and the product evidence they lack. Those findings can inform GEA contexts, creative and landing pages wherever the advertising platform supports them. A prompt cluster is a planning input; it is not a promise that an advertiser can target the exact conversation.
Turn the strongest commercial hypotheses into paid tests. Compare incremental customer acquisition cost, incremental revenue per unit of ad spend, contribution margin and marginal returns. A high click-through rate or a strong platform-reported ROAS can justify investigation, but it does not establish that the campaign created additional sales.
Where scale and platform controls permit, compare four groups: neither intervention, GEO only, GEA only, and both. This can test whether organic improvements and paid activity reinforce each other or mainly reach customers who would have bought anyway. Otherwise, use separate controlled tests and be explicit about what remains unknown. Keep paid exposure and organic visibility as distinct inputs, and avoid counting the same sale twice.
The objective is to invest the next euro where the evidence suggests the strongest incremental return. Our introduction to generative engine advertising explains how the paid channel relates to GEO.
Make GEO and GEA part of the ROI platform
The ROI platform should bring AI visibility, analytics, experimentation, media costs and business outcomes into one decision process. Whether it is an existing measurement platform or a warehouse with BI reporting, it needs shared definitions and a clear owner.
Agree a common taxonomy for time period, market, product category, engine, prompt cluster and campaign. Link intervention dates and costs to aggregated analytics, CRM and sales data at a defensible level of detail. Preserve the distinction between observed revenue, attributed revenue and estimated incremental revenue; those are different views of the same business, not numbers to add together.
Give marketing and finance a regular review of what changed, what the evidence supports and what should happen next. Each recommendation should carry its measurement method, uncertainty, full cost and expected marginal return. When the data cannot yet support a separate GEO estimate, the platform should show the next measurement step.
At Meikai, our view is that AI visibility should inform the same investment decisions as every other growth channel. That means connecting prompt intelligence and GEO execution to analytics, incrementality and MMM. Talk to our team about bringing GEO and GEA into your business measurement approach.
Method note: this framework combines prompt research, business measurement and causal testing. Product documentation linked above was checked on 23 October 2026; the numerical example is illustrative.
Frequently asked questions
How do you measure the ROI of GEO?
Estimate additional sales or qualified pipeline against a credible counterfactual, convert the result into contribution, and subtract the full programme cost. Divide that net return by programme cost. Visibility and referral conversions help explain performance, but neither alone establishes incremental ROI.
Can MMM identify which prompts generate sales?
MMM can guide investment across channels, markets and categories when the data supports that detail. Combine those results with prompt research and controlled tests to prioritise themes. A conventional MMM cannot reliably assign revenue to individual prompts.
Can Google Analytics and Adobe Analytics measure all GEO impact?
Both can measure identifiable referral and campaign journeys and associated outcomes when tracking is configured. They cannot observe every AI recommendation, recover every missing referrer or establish causal sales lift from attribution alone. Use analytics alongside experiments, MMM and sales records.
How does GEO help improve GEA efficiency?
GEO research identifies buyer needs, competitive gaps and product evidence that can inform paid contexts, creative and landing pages. Test those hypotheses against incremental acquisition cost and contribution, and evaluate overlap between paid and organic activity before increasing investment.