 MEIKAI
Alibaba removed the pages. AI platforms kept citing them.
On 27 March 2026, our crawler began downloading unusually small pages from Alibaba's /product-insights/ directory. A typical article had weighed about 84 KB. The new responses were closer to 3.3 KB and displayed a generic “404-Error” page, even though the server still returned HTTP 200. The articles had become soft-404s.
That first removal was not the end of the experiment. Article-sized content briefly returned from 3-8 June, then disappeared again from 9 June. On 22 July, the sampled pages were soft-404s once more, but AI platforms were still citing them.
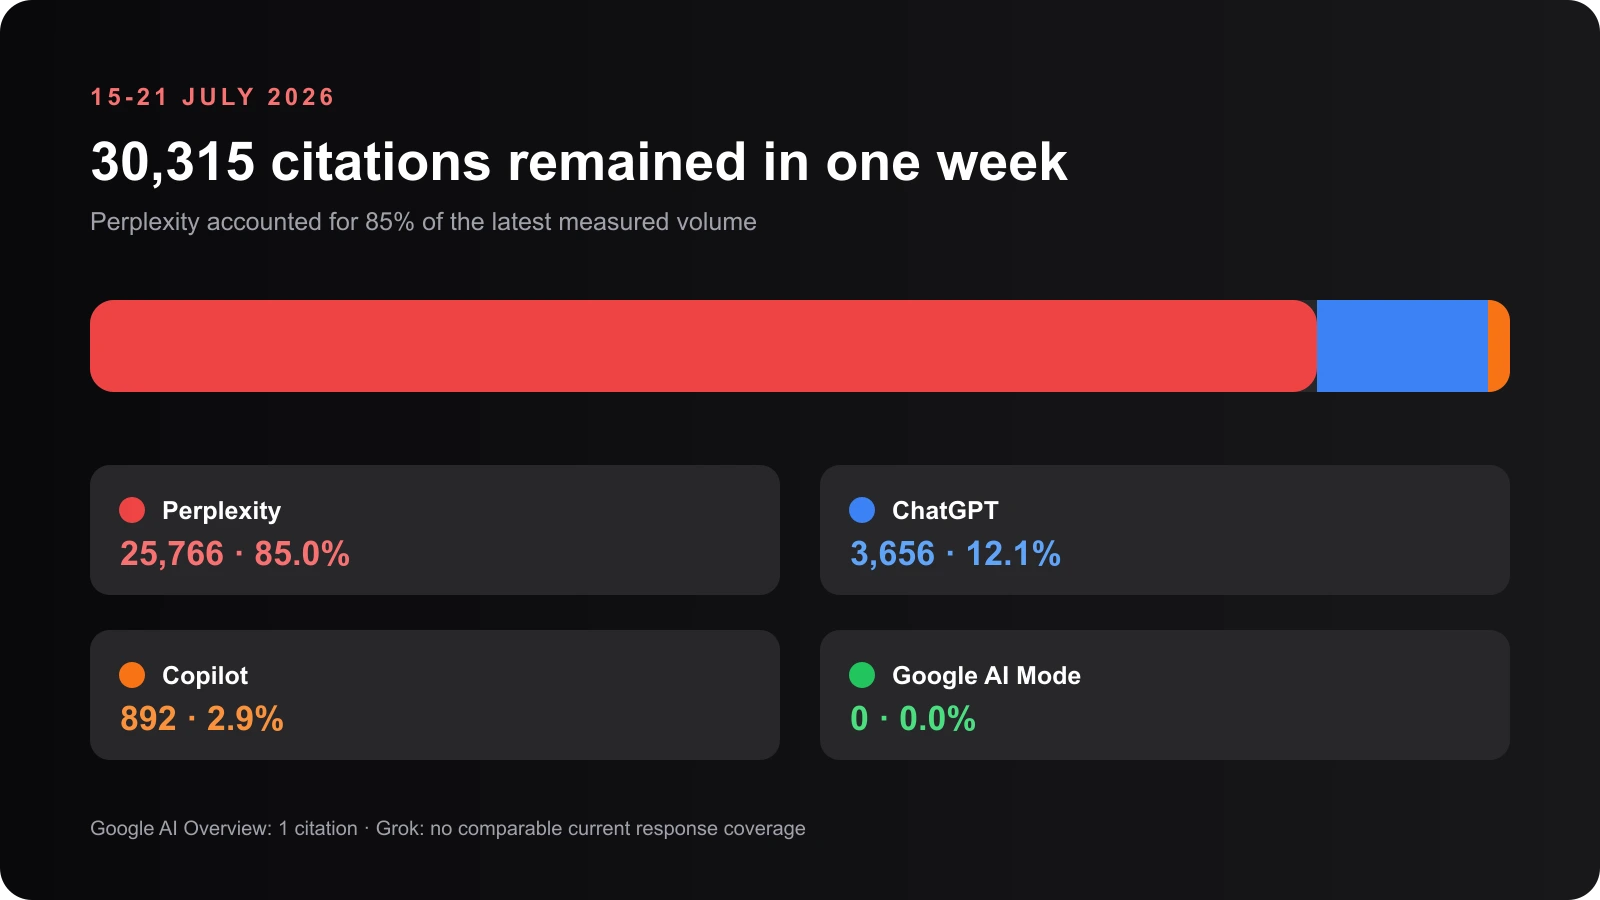
From 15-21 July, Meikai recorded 30,315 citations to Alibaba Product Insights URLs - an average of 4,331 a day. Perplexity generated 85% of that volume.
The July update changes the interpretation. Citation decay is not one clean half-life. Availability changed twice, and the five platforms in our panel moved at very different speeds. Google AI Mode halved within a week of the takedown. ChatGPT took thirteen weeks. Perplexity never halved at all.
The takedown became a two-episode experiment
Meikai was already running the same brand-monitoring prompts each day across ChatGPT, Perplexity, Google AI Mode, Grok and Microsoft Copilot. The first removal landed in the middle of that panel, creating observations from before and after the pages disappeared. Our approach to building a representative measurement set is described in Why prompt modeling is the foundation of AI visibility.
| Period | Observed availability |
|---|---|
| Through 26 March | Article content present |
| 27 March onward | First soft-404 episode |
| 9 June-22 July | Second soft-404 episode, 835 normalized URLs confirmed |
The June revival matters because it may have enabled renewed crawling or retrieval. The decline after 9 June is therefore better understood as decay after a second removal, not as one uninterrupted 116-day decay curve beginning in March.
Nearly one million citation rows
From 1 March through 21 July, the observation window contained 997,614 citation rows pointing to 93,917 distinct exact Product Insights URLs. Those citations appeared in 469,250 AI responses and involved 246 monitored brands.
| Measure | March 1-July 21 total |
|---|---|
| Citation rows | 997,614 |
| Distinct exact URLs | 93,917 |
| Citing responses | 469,250 |
| Citing brands | 246 |
These cumulative totals describe the full monitored scope, which expanded over time. They should not be read as a fixed-cohort trend. For a like-for-like comparison, the analysis uses the original 126-brand cohort separately.
Persistence became platform-specific
The latest complete seven-day window makes the divergence clear. Perplexity produced 25,766 citations, while ChatGPT produced 3,656 and Copilot 892. Google AI Mode produced none despite 169,640 measured responses across the current panel. Grok had no comparable response coverage, so its current level is unknown, not zero.
| Platform | 15-21 July citations | Share |
|---|---|---|
| Perplexity | 25,766 | 85.0% |
| ChatGPT | 3,656 | 12.1% |
| Copilot | 892 | 2.9% |
| Google AI Overview | 1 | <0.1% |
| Google AI Mode | 0 | 0.0% |
| Grok | Not available | No current coverage |
One platform remained above baseline
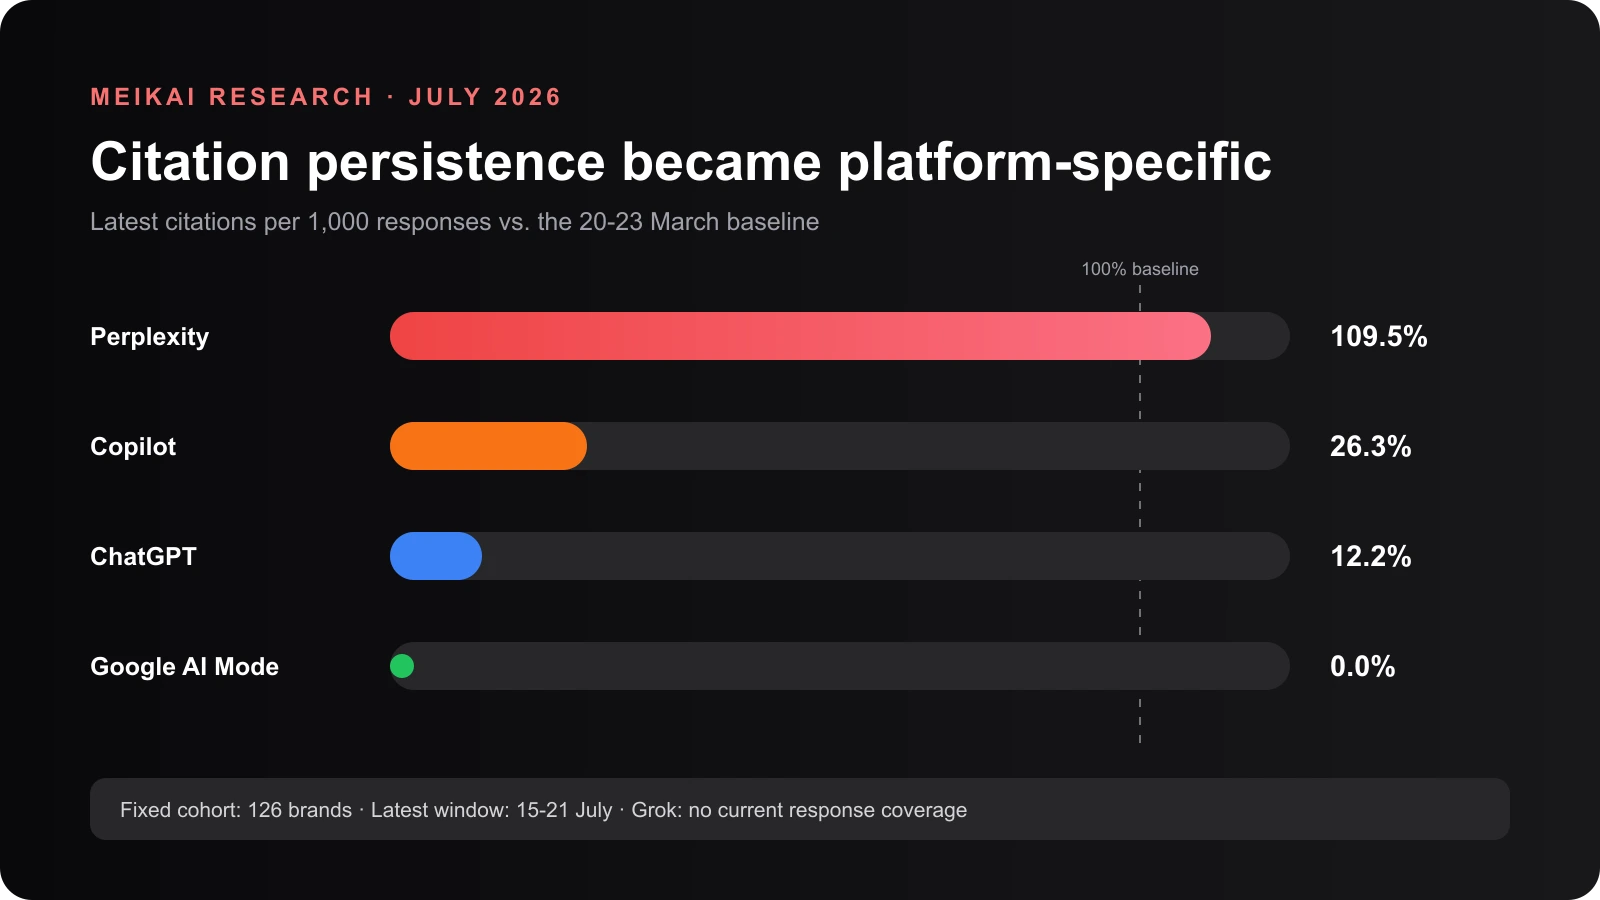
Raw totals can move when the number of monitored prompts or platform responses changes. To separate persistence from response volume, we compared citations per 1,000 responses for the original 126 brands. The baseline is 20-23 March and the latest window is 15-21 July.
| Platform | Baseline to latest citations per 1,000 responses | Retention |
|---|---|---|
| Perplexity | 139.0 → 152.2 | 109.5% |
| Copilot | 21.7 → 5.7 | 26.3% |
| ChatGPT | 166.1 → 20.2 | 12.2% |
| Grok | 94.5 → 5.6 (15-21 May) | 5.9%, last known |
| Google AI Mode | Baseline rate not comparable → 0 | 0.0% |
Google AI Mode recorded 4,671 citations a day during the March baseline and no citations in the latest window. The March response denominator is not included in this extract, so the table does not present that daily count as a per-1,000 response rate. Grok has no response coverage after 22 May, so its latest figure is the week of 15-21 May rather than July.
Perplexity was the exception: its response-normalized citation rate remained above the March baseline. ChatGPT and Copilot decayed substantially, while Google AI Mode reached an observable zero. A blended average would hide all three behaviors.
The endpoints hide four different speeds
Two measurements four months apart cannot tell a cliff from a slow glide. Both produce the same retention number. So we recomputed the same metric for every complete week from 2 March to 19 July: citations per 1,000 responses, same 126 brands. Then we put one question to each platform. How long did it take to fall below half of what it cited before the pages disappeared?

| Platform | Pre-removal rate, week of 16 March | Weeks to fall below half | Latest week measured |
|---|---|---|---|
| Google AI Mode | 341.8 | 1 | 0.0 (13 July) |
| Grok | 80.7 | 5, before coverage ended | 3.8 (18 May) |
| ChatGPT | 205.9 | 13 | 21.9 (13 July) |
| Copilot | 18.1 | 13 | 5.1 (13 July) |
| Perplexity | 113.8 | Never | 143.1 (13 July) |
The reference is the week of 16 March, the last full week before the removal. That is a different window from the 20-23 March baseline used in the retention table above. A platform counts as having fallen below half on the first observed week that sits under that line and stays under it.
Google AI Mode did not decay in the usual sense. It stopped. From 28 March, the day after the pages became soft-404s, it recorded no Product Insights citations until 4 April. Over those same days it was still citing roughly 161,000 other URLs a day. The blackout is a behaviour, not a collection failure. Citations resumed on 5 April at about 45% of the pre-removal rate. They drifted down through April and were effectively gone by 9 May.
ChatGPT is the slow case. It held between 63% and 83% of its pre-removal rate for the whole of April. It first touched half in mid-May, then recovered after the June revival. It settled below half only from the week of 22 June, two weeks after the second removal. Copilot first moved the other way. It peaked at 48.3 citations per 1,000 responses in the week of 25 May, nearly three times its pre-removal rate, before collapsing on the same schedule. For both, the second removal did the work the first one did not.
Perplexity never crossed the line. Its weakest post-removal week was 85% of the pre-removal rate. It finished the window at 126%.
New URLs kept appearing
Meikai first observed 36,672 exact Product Insights URLs after 27 March, using citation history back to 1 December 2025. Those URLs accumulated 261,830 post-takedown citations and represented 35.9% of all citations after the first removal.
“First observed” does not mean “first published.” Some URLs may have existed earlier without appearing in our citation stream. The pattern does show that the platforms were doing more than repeating a fixed set of URLs already visible before the takedown. Possible mechanisms include delayed discovery, retained indexes, recycled snippets or retrieval from downstream copies. Citation telemetry alone cannot identify which one applies.
What a citation count leaves out
A citation row records a URL in an AI response. It does not prove that the platform fetched the page live, that the page still contains the cited information or that the information remains current.
Page availability therefore needs its own status. A basic uptime test would miss Alibaba's error shell because the server returns HTTP 200. An AI crawlability audit needs to inspect the returned content and distinguish live pages, redirects, hard 404s and soft-404s.
Coverage also changes the interpretation. Zero citations across a large set of measured responses is evidence. No measured responses, as with Grok in the latest window, is an unknown state. The two should never be reported as equivalent.
What this means for GEO measurement
- Separate visibility from availability. Report whether cited content is live, redirected or missing.
- Use platform-specific decay curves. A blended score conceals the difference between Perplexity, ChatGPT, Copilot and Google AI Mode.
- Measure the trajectory, not two endpoints. A one-week cut-off and a thirteen-week glide produce the same before-and-after number.
- Normalize by response volume. Track citations per 1,000 responses alongside raw counts.
- Treat availability episodes as resets. A republishing window can create a new retrieval opportunity and a new removal date.
- Make coverage gaps explicit. Distinguish an observed zero from missing platform coverage.
Citation volume remains informative, but only when it is labelled accurately. Without availability, response-volume and coverage checks, a single AI visibility score can mix current visibility with residual visibility.
It also rules out one tempting shortcut on the paid side. If a third-party page change alone can move citations eightfold on one platform and not at all on another, that score cannot serve as the control group for an advertising campaign running over the same weeks. Our guide to the best GEA platforms sets out what to measure instead.
Methodology note
This analysis combines Meikai citation telemetry, platform-response denominators, scrape evidence and direct live checks. Citation metrics cover 1 March through 21 July 2026. We exclude 22 July because the day was incomplete. A citation row represents one exact Alibaba Product Insights URL cited in one AI response, with query strings and fragments removed for first-observed URL analysis.
Cumulative and latest-week totals use all monitored brands, of which 246 cited the content during the observation window. Like-for-like retention uses the original 126-brand cohort, comparing the 20-23 March baseline with 15-21 July. Availability findings use sampled scrape records, article-size and page-title signals, HTTP status and live checks.
The weekly series uses the same 126-brand cohort and the same citations-per-1,000-responses metric, aggregated into complete Monday weeks from 2 March to 19 July. The week of 16 March is the pre-removal reference. Days on which a platform's overall citation collection was degraded, defined as below 40% of its own 29-day rolling mean across all domains, are excluded from both the numerator and the denominator. A collection gap therefore cannot be read as decay. A week is reported once at least 20,000 responses survive that filter. That is enough to estimate a rate even in weeks where fewer than seven days did. Grok is the only series that stops early. It has no response coverage after 22 May. That absence is left blank rather than drawn as zero.
Limits: A citation is not proof that a model retrieved a URL live. First observed is not the same as first published. Scrape coverage is sampled, not an exhaustive census of every historical URL. The monitored panel expanded, so cumulative totals and fixed-cohort retention answer different questions. Grok's present state is unknown because current response coverage is absent.
Sources and further reading
- Meikai, Alibaba Product Insights LLM Citation Persistence - July 2026 Update (data through 21 July 2026).
- Alibaba robots.txt (checked 22 July 2026).
- The Great Un-Indexing: Alibaba Product Insights case study.
- Google Search Central: Page indexing report.